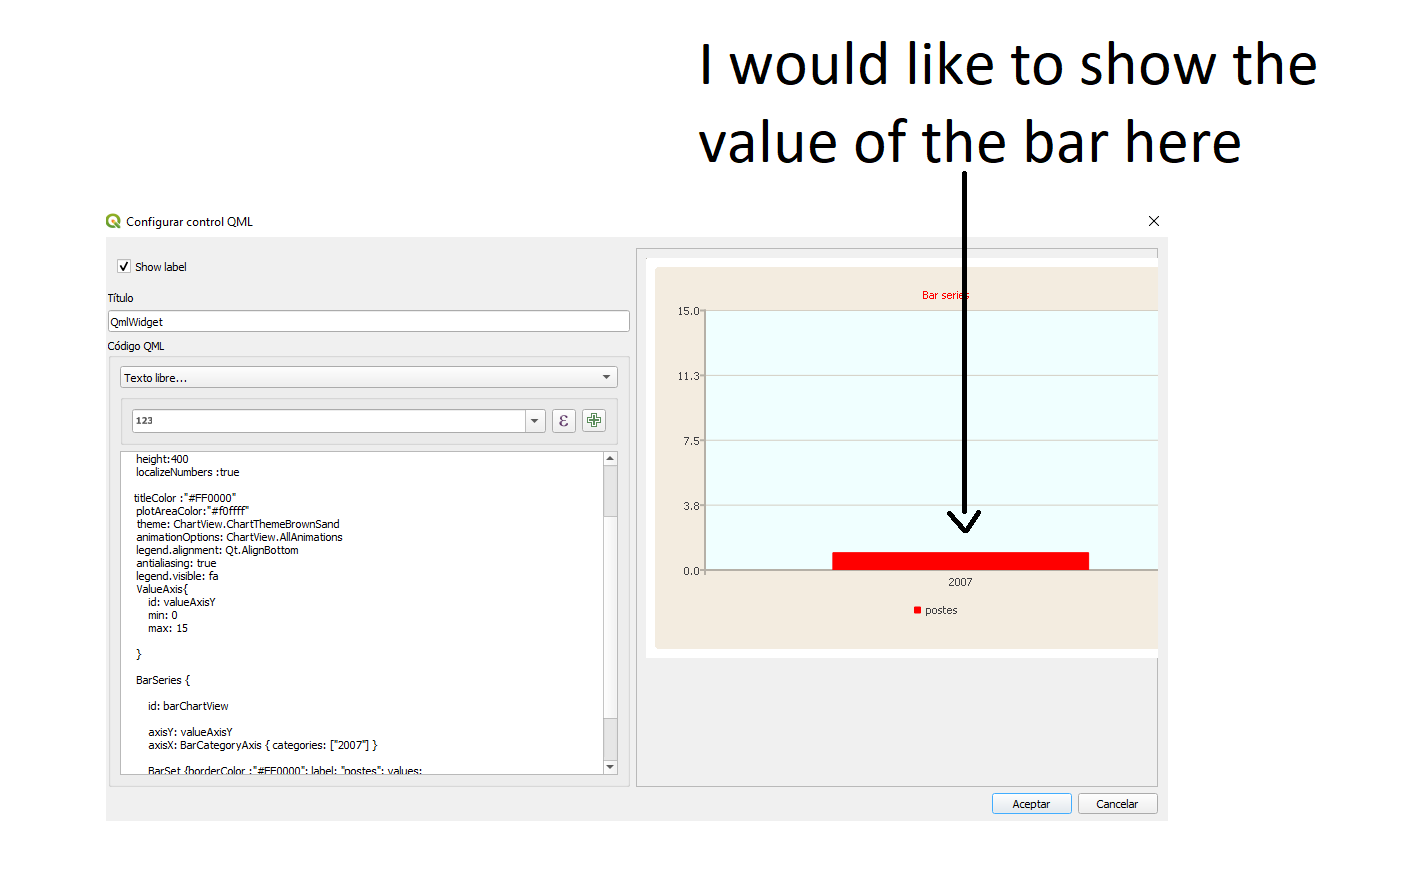
Hi, I’m trying to make a histogram that displays the Qfiel app form, so far I’ve managed to create the histogram but what I haven’t been able to do is display the value on the histogram bar, can anyone help me, attached image and code that you make:
code:
**import QtQuick 2.0
import QtCharts 2.0
ChartView {
title: “Bar series”
width: 600
height:400
localizeNumbers :true
titleColor :“#FF0000”
plotAreaColor:“#f0ffff”
theme: ChartView.ChartThemeBrownSand
animationOptions: ChartView.AllAnimations
legend.alignment: Qt.AlignBottom
antialiasing: true
legend.visible: fa
ValueAxis{
id: valueAxisY
min: 0
max: 15
}
BarSeries {
id: barChartView
axisY: valueAxisY
    axisX: BarCategoryAxis { categories: ["2007"] }
    BarSet {borderColor :"#FF0000"; label: "postes"; values: [expression.evaluate("\"CONSECUTIV\"")];color :"#FF0000"}

}
}**
Imported from GitHub discussion by @CACG1022 on 2023-03-21T13:02:10Z
this is code:
import QtQuick 2.0
import QtCharts 2.0
ChartView {
title: “Bar series”
width: 600
height:400
localizeNumbers :true
titleColor :“#FF0000”
plotAreaColor:“#f0ffff”
theme: ChartView.ChartThemeBrownSand
animationOptions: ChartView.AllAnimations
legend.alignment: Qt.AlignBottom
antialiasing: true
legend.visible: fa
ValueAxis{
id: valueAxisY
min: 0
max: 15
}
BarSeries {
id: barChartView
axisY: valueAxisY
axisX: BarCategoryAxis { categories: [“2007”] }
BarSet {borderColor :“#FF0000”; label: “postes”; values: [expression.evaluate(“"CONSECUTIV"”)];color :“#FF0000”}
}
}
Imported from GitHub comment by @CACG1022 on 2023-03-21T13:06:47Z
Workaround (because I think you can’t do that as you want, but I’m a rookie with Qt) : at ‘BarSet’ line, replace label: "postes" by label: expression.evaluate("concat('postes (',\"CONSECUTIV\",')')") which shows the number in legend (only if your graph has 1 bar)
Imported from GitHub comment by @VxTedxV on 2023-03-22T21:42:21Z