I have been working on a QField Project Plugin for Vegetation Monitoring for my organisation. To help other developers who are also trying to make project plugins, I have turned it into a series of code demonstrations. I start with a demo1_hello_world and work my way up component by component to the complete plugin in demo5_species_entry. I hope it can be of use for you!
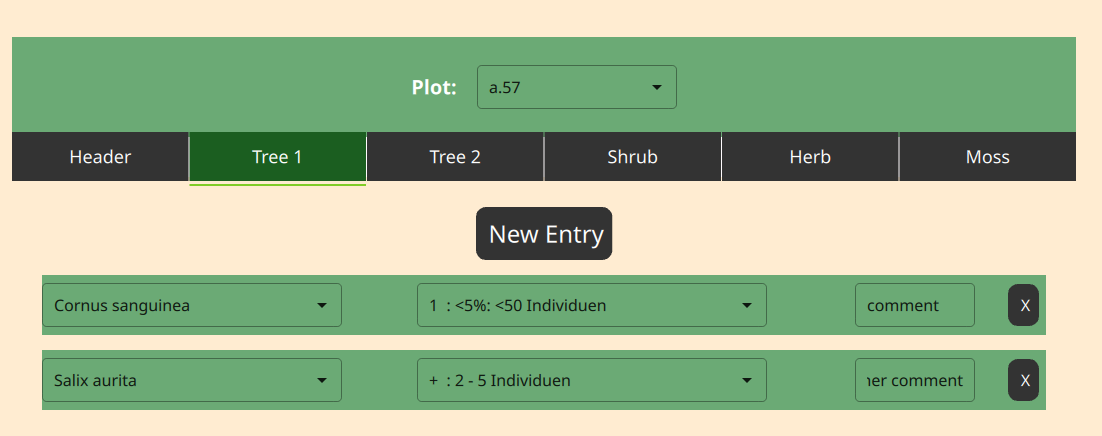
This plugin is rich in widgets and interactions: there is a search bar, a cool swipey tab widget, and a neat dynamic list widget. It demonstrates querying, adding, deleting and editing features. There is a data model for dynamically generated widgets and a central style.
It does not at the moment have a connection to the map- to click on a plot and open the plugin. The user has to select the plot by plot_id in the search bar. I am currently working on a mapclick demo that will add this functionality. I’ll post when it’s up.
Note: This is developed to be used on an iPad. From demo3 and up it will be squished on an iPhone.
Are you also working on project plugins? I’d love to hear from other developers.
Hey @Mathieu_Pellerin, I see that 3.7.2 is out and I can’t wait to try out your new functionality! I’ll let you know what I come up with! Thanks for all your work!